
Related Articles


Pilling: causes and prevention
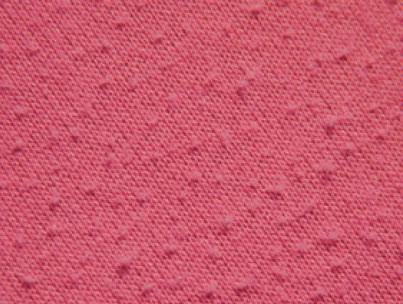
When we look at an example of pilling, there is a simple statement we can make: “With USTER® STATISTICS, this wouldn’t have happened.” In most cases, fabric defects can be traced back to the yarn – not necessarily ‘bad’ yarn, but usually yarn with the wrong quality specification for its intended end-use. With pilling, the cause is generally a yarn which is too hairy. Defining the level of hairiness – the H value – in a yarn is achieved by measuring with the USTER® TESTER 5, to assess the protruding fibers in the yarn. Spinners will carry out this routine under lab conditions, testing yarn packages with the optical sensors in the USTER® TESTER 5, at a speed of 800 meters per minute. This instrument tests a wide range of quality parameters, also including evenness and imperfections such as thin places, thick places and neps. The numerical H value resulting from the test is automatically matched against percentile levels in USTER® STATISTICS. These percentiles, known as USPsTM, show by how much the yarn is above or below a certain value, based on comparisons with what other spinning mills worldwide are producing. For example, the 5% level means 5% of mills worldwide are producing yarn with equal or better quality levels for the particular parameter being compared. The same applies to the limit levels of 25%, 50%, 75% and 95% shown up by the USTER® STATISTICS. In the fabric example illustrated here, the level of pilling was produced by a yarn with an H value of 7.71, equivalent to a USPTM of 95% – clearly showing that the yarn hairiness was too high for the end-use. To avoid pilling, a fabric specialist would be able to determine that, in this case, a yarn with hairiness USPTM of 50% would have been required.
Uneven fabric appearance: a clear view
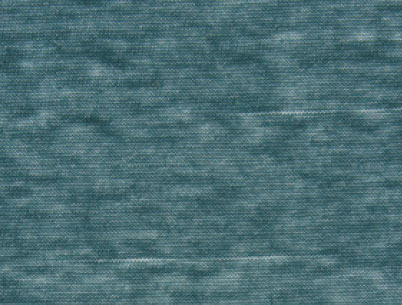
 A second example (Figure 2) shows another kind of defect which can also lead to lost customers at any stage of the manufacturing process: uneven fabric appearance with very visible faults and inconsistencies that are always going to be unacceptable. This type of defect has a number of likely causes, all showing up in the yarn: too many neps in the raw material; too many short fibers in the yarn (possibly caused by incorrect settings at the combing machine); poorly-maintained machinery; or defective rollers on the ring spinning machine. And, once again, we can confidently say: “With USTER® STATISTICS, this wouldn’t have happened.” First, we have to accept that it is not possible to produce a ‘perfect’ yarn, even with excellent modern technology. To eradicate the kind of unsatisfactory uneven fabric appearance seen in this example, we must focus on the yarn quality parameter known as CVm, for Coefficient of Variation of mass. Experience has proved that this characteristic strongly impacts on how we can expect the finished fabric to look. Here also, the USTER® TESTER 5 provides the vital test data, derived from its unique capacitive measuring system. And here again, the correlation with USTER® STATISTICS percentiles is critical to understanding and controlling the yarn properties to ensure a satisfactory fabric appearance. For most fabrics, a 50% USPTM level for CVm is likely to give an acceptable result, while certain types of more critical woven or knitted structures call for a CVm around 25%. Even 75% CVm values might work for less-demanding fabric needs. Beyond that, however, there is a serious risk of uneven fabric appearance. In our example here, the measured CVm value of 13.9 translates into a USPTM of 80% – explaining why the fabric obviously does not make the grade in terms of appearance.
Yarn profiles: specifying quality objectively
 Today, quality-conscious spinners take advantage of this connection between CVm levels, USTER® STATISTICS and fabric appearance to define the required CVm level and USPTM value in advance of a yarn contract. This approach, with close collaboration between the yarn producer and the user, is part of an overall specification known as a yarn profile, covering all the appropriate quality parameters. In this way, both parties can be confident that the yarn will precisely match the requirements of the intended fabric application. It takes the guesswork out of a business agreement, and fosters good relationships between customer and supplier all along the chain. The examples given here underline the real and practical advantages USTER® STATISTICS bring to the textile industry. The basis for these benefits is a substantial and extensive project – running over five or six years – to prepare each edition of USTER® STATISTICS. It involves the thorough collection and testing of several thousand samples, carefully targeted to be representative of worldwide textile production capacities. The results are fed into unique data analysis software for interpretation and calculation of the percentile curves. Finally, the USTER® STATISTICS are issued in the form of powerful interactive software, accessed via the internet or on CD. USTER® STATISTICS – a powerful and practical quality resource, freely available for all, helping the textile industry to deal with pilling and uneven fabric appearance – and much more besides.